Since leaders first started talking about tackling the problem of climate change, the world has spewed more heat-trapping gases, gotten hotter and suffered hundreds of extreme weather disasters. Fires have burned, ice has melted and seas have grown.
The first United Nations diplomatic conference to tackle climate change was in Rio de Janeiro in 1992. Here’s what’s happened to Earth since:
- The carbon dioxide level in the air has jumped from about 358 parts per million to nearly 412, according to the U.S. National Oceanic and Atmospheric Administration. That’s a 15% rise in 27 years.
- Emissions of heat-trapping carbon dioxide from fossil fuel and industry jumped from 6.06 billion metric tons of carbon in 1992 to 9.87 billion metric tons in 2017, according to the Global Carbon Project. That’s a 63% increase in 25 years.
- The global average temperature rose a tad more than a degree Fahrenheit (0.57 degrees Celsius) in 27 years, according to NOAA.
- Since Jan. 1, 1993, there have been 212 weather disasters that cost the United States at least $1 billion each, when adjusted for inflation. In total, they cost $1.45 trillion and killed more than 10,000 people. That’s an average of 7.8 such disasters per year since 1993, compared with 3.2 per year from 1980 to 1992, according to NOAA.
- The U.S. Climate Extremes Index has nearly doubled from 1992 to 2018, according to NOAA. The index takes into account far-from-normal temperatures, drought and overall dry spells, abnormal downpours.
- Nine of the 10 costliest hurricanes to hit the United States when adjusted for inflation have struck since late 1992. The other one, Andrew at No. 6, hit in August 1992, according to NOAA.
- The number of acres burned by wildfires in the United States has more than doubled from a five-year average of 3.3 million acres in 1992 to 7.6 million acres in 2018.
- The annual average extent of Arctic sea ice has shrunk from 4.7 million square miles (12.1 million square kilometers) in 1992 to 3.9 million square miles (10.1 million square kilometers) in 2019, according to the National Snow and Ice Data Center. That’s a 17% decrease.
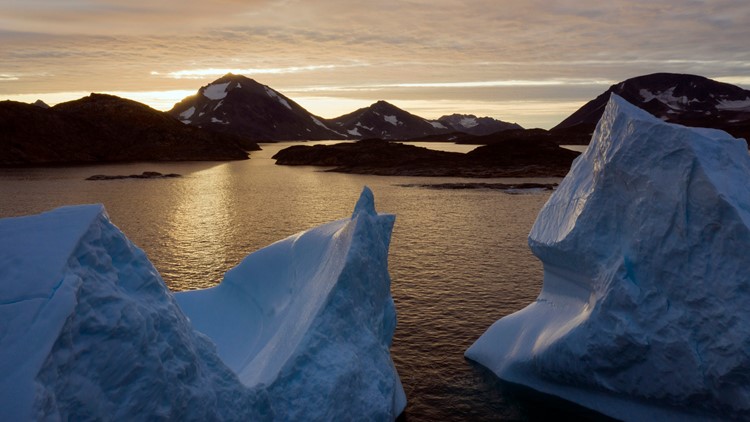
- The Greenland ice sheet lost 5.2 trillion tons (4.7 trillion metric tons) of ice from 1993 to 2018, according to a study in the Proceedings of the National Academy of Sciences.
- The Antarctic ice sheet lost 3 trillion tons (2.7 trillion metric tons) of ice from 1992 to 2017, according to a study in the journal Nature.
- The global sea level has risen on average 2.9 millimeters a year since 1992. That’s a total of 78.3 millimeters, or 3.1 inches, according to NOAA.
RELATED VIDEO:
Other stories on 13 ON YOUR SIDE:
►Make it easy to keep up to date with more stories like this. Download the 13 ON YOUR SIDE app now.
Have a news tip? Email news@13onyourside.com, visit our Facebook page or Twitter. Subscribe to our YouTube channel.